Rock LaManna10.06.17
I can’t tell you how many times I get asked this question. It’s usually from owners who are considering putting their business on the market for sale. They’re testing the waters, hoping the multiples are high enough so if they sell, they get to spend the rest of their lives on the beach.
And I typically give the same vague answer: It depends.
First and foremost, the multiple for the label and narrow web industry is subjective, not objective. It’s based more on your company financials and individual performance than the industry as a whole.
Believe me, if you have a huge client base locked into long-term contracts, then I don’t care what industry you’re in. Your company is going to be worth more money than the industry.
Multiples do serve as a benchmark for some investors and companies, however. But let me share some research that shows how wide-ranging they can be.
PeerComps Comparable Report
We recently ran a PeerComps report to give us an idea of how much the multiples are for the printing industry.
A little background on PeerComps, which I’ve mentioned in previous columns. Launched in 1998, PeerComps and their affiliates have gathered information on over 8,000 transactions. These are companies that have been sold, and with each transaction categorized by NAICS code, industry classification, keyword or other financial variabilities.
Your research is only as good as your data pool, and it should be noted that this multiples report from PeerComps shows multiples based on 215 closed transactions. We don’t know specifically how many of these closed transactions deal primarily in labels, as there is no NAICS code for labels and narrow web companies.
This report is based on the following NAICS codes, and it includes transactions (in parentheses) in the following specific areas:
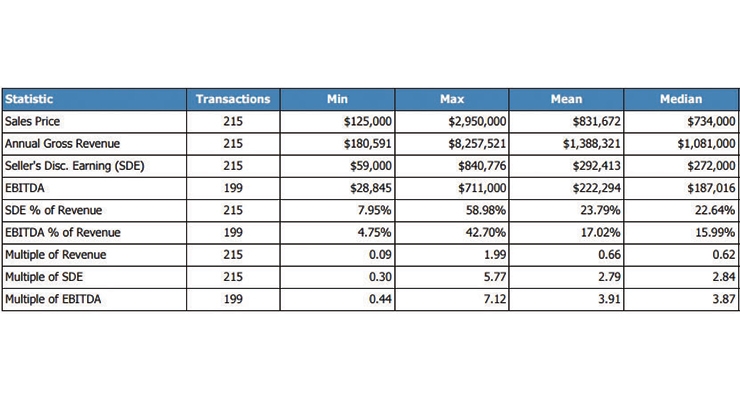
The sales price on these transactions ranged from $125,000 to $2,950,000. The important numbers to investors are the Seller’s Discretionary Earnings (SDE) and the Earnings Before Interest, Tax and Depreciation and Amortization (EBITDA).
Again, the range is wide, especially on the EBITDA percent of revenue. That’s an indication of margins and extremely important to the investor.
Finally, at the bottom of the chart is the multiple of EBITDA, which on these transactions will range from .44 to 7.12. The mean (or average) is 3.91, which is typically what I give as a ballpark answer when people ask about the average multiple.
Why Is EBITDA Important To Investors?
EBIDTA is a profitability ratio, and it gives investors a look at the operational performance of the company. As Investopedia notes in their definition of EBITDA, “Ignoring tax and interest expenses allows analysts to focus specifically on operational performance. Depreciation and amortization are noncash expenses, so EBITDA also provides insight regarding approximate cash generation and operations controlled for capital investments.”
The margins will measure the income generation relative to revenue and give a good sense of the company’s operational efficiency. This is particularly useful when a big company is looking to acquire a smaller company and tuck it into an overall operations.
EBITDA is just one benchmark that investors consider. As you can see in the chart above, as a percentage of revenue, the transactions recorded above range from 4.75% to 42.75%. That’s a pretty hefty swing, when the EBITDA multiple is ranging from .44 to 7.12. That “hefty swing” is why investors consider two multiples: The industry multiple and your own multiple. They want to see industry multiples as a whole, to ensure that your sector is a good one. But they also want to see how you’re performing when stacked up against the competition.
Why Is Seller’s Discretionary Earning Important?
The seller’s discretionary earnings include pretax and pre-interest profits before non-cash expenses; one owner’s benefits; one-time investments; and any non-related income or expenses, as noted by Mark Daoust on his QuietLight Brokerage website.
To clarify, it’s all about the amount of income being paid to the owner. This gives an investor an idea of the realistic earnings that can be expected with a business.
There are a variety of other types of expenses that can be factored into the SDE, such as large one-time expenses; multiple owners’ compensation; and adjusted expenses. This is where the accounting and finance teams step in. Regardless of the details, you can see why this metric is important, as well. SDE ranges from $59,000 to $840,776 in the report. Because this number can include a whole host of factors, it will be scrutinized by the investor.
Investors Consider Other Intangibles
This type of report is the perfect place to start as you begin to assess your own operation and consider selling your company. Now you need to put yourself in an investor’s shoes, and consider that they’ll be looking at a number of things beyond EBITDA.
Is your company growing? They’ll want to know what your Compounded Annual Growth Rate is, and whether you’re gaining new accounts. They’ll also want to know if you’re diversified in your clients, and they’ll especially want to ensure that all of your revenue isn’t coming from 1-2 clients.
What is the industry doing? Investors will look to see what the overall EBITDA rate is, but they’ll also look at the overall trends. Is there growth? Consolidation? Capacity to expand? Remember, an investor is all about the long-term, not what you’ve done in the past.
Is your company innovative and well-managed? I can’t tell you how undervalued talent is in this day and age. We focus so heavily on the types of reports I’ve included in this column that we forget it’s all about the people behind the scenes. If you have a talent-laden team and a culture that encourages innovation and thinking big, you can expect to drive your price tag higher.
How solid is your cash flow? Cash flow is the lifeblood of all businesses, and any investor wants to see that you have great cash flow as part of the equation. You can see how the investor moves from the big picture to a more granular view of your business. These performance indicators are often the backbone of the negotiations, and give both parties a place to start discussions.
It’s why we always encourage a valuation before you put your business on the marketplace. Consider the story of Brad Van Leeuwen of Trade Print Finishing.
Family Business That Values An Outsider Perspective
One of the main difficulties investors have when assessing the value of a family business is establishing comparables. Because a family business is not obligated to disclose financials like a publicly-traded company, it can be difficult to compare apples to apples.
Bankers rely on organizations like RMA Data to provide anonymous, pooled results (much like the PeerComps report we presented earlier).
But what does an owner do when they want to put their business on the market? Too often an owner struggles with their own business value because they don’t know what investors are truly looking for. That’s why we encourage a business valuation, a recommendation heeded by Brad Van Leeuwen of Trade Print Finishing.
Setting The Wheels In Motion
Brad was a third generation family business owner, having taken ownership of the company originally started by his grandfather. Originally, the company specialized in engraving social announcements and stationery, which eventually evolved into wide format printing finishing processes like foil stamping, diecutting and UV coating.
Early retirement had always been one of his goals, but Brad could never seem to get the wheels in motion for selling his business. He talked about selling to his operations manager, but the plan never seemed to gain any traction.
Finally, Brad decided he could wait no longer. But he didn’t know how he stacked up against the competition or how to set his price.
He decided to get a business valuation. Brad had been tracking his equipment value for years, and he’d assumed that would dictate the true value of the company. The valuation, however, revealed otherwise.
Profitability, Not Assets, Drives The Price
“I had always watched the equipment to see what I could sell it for if I had to liquidate,” he said. “But the valuation indicated that profitability was the true driver of value.”
It’s not just profitability today, either. It’s the long-term outlook –will you be profitable 3-10 years down the line? It’s why the numbers like EBITDA factor into a company’s valuation, but there are so many factors that establish your own multiple.
That’s the ultimate takeaway. It’s not just industry multiples on which you need to focus. It’s your own personal multiple. These benchmarks are a good starting point, but once you see what the landscape is like, then it’s really time to get to work.
Remember, it’s not the industry multiples I tell you that ultimately matter in the end. It’s what the valuation indicates to an investor that dictates how much your business is truly worth.
Rock LaManna, President and CEO of LaManna Alliance, helps printing owners and CEOs use their company financials to prioritize and choose the proper strategic path. He can be reached by email at Rock@RockLaManna.com
And I typically give the same vague answer: It depends.
First and foremost, the multiple for the label and narrow web industry is subjective, not objective. It’s based more on your company financials and individual performance than the industry as a whole.
Believe me, if you have a huge client base locked into long-term contracts, then I don’t care what industry you’re in. Your company is going to be worth more money than the industry.
Multiples do serve as a benchmark for some investors and companies, however. But let me share some research that shows how wide-ranging they can be.
PeerComps Comparable Report
We recently ran a PeerComps report to give us an idea of how much the multiples are for the printing industry.
A little background on PeerComps, which I’ve mentioned in previous columns. Launched in 1998, PeerComps and their affiliates have gathered information on over 8,000 transactions. These are companies that have been sold, and with each transaction categorized by NAICS code, industry classification, keyword or other financial variabilities.
Your research is only as good as your data pool, and it should be noted that this multiples report from PeerComps shows multiples based on 215 closed transactions. We don’t know specifically how many of these closed transactions deal primarily in labels, as there is no NAICS code for labels and narrow web companies.
This report is based on the following NAICS codes, and it includes transactions (in parentheses) in the following specific areas:
- 323110 - Commercial Lithographic Printing (48)
- 323111 - Commercial Gravure Printing (1)
- 323113 - Commercial Screen Printing (40)
- 323114 - Quick Printing (29)
- 323115 - Digital Printing (5)
- 323117 - Books Printing (1)
- 323119 - Other Commercial Printing (92)
The sales price on these transactions ranged from $125,000 to $2,950,000. The important numbers to investors are the Seller’s Discretionary Earnings (SDE) and the Earnings Before Interest, Tax and Depreciation and Amortization (EBITDA).
Again, the range is wide, especially on the EBITDA percent of revenue. That’s an indication of margins and extremely important to the investor.
Finally, at the bottom of the chart is the multiple of EBITDA, which on these transactions will range from .44 to 7.12. The mean (or average) is 3.91, which is typically what I give as a ballpark answer when people ask about the average multiple.
Why Is EBITDA Important To Investors?
EBIDTA is a profitability ratio, and it gives investors a look at the operational performance of the company. As Investopedia notes in their definition of EBITDA, “Ignoring tax and interest expenses allows analysts to focus specifically on operational performance. Depreciation and amortization are noncash expenses, so EBITDA also provides insight regarding approximate cash generation and operations controlled for capital investments.”
The margins will measure the income generation relative to revenue and give a good sense of the company’s operational efficiency. This is particularly useful when a big company is looking to acquire a smaller company and tuck it into an overall operations.
EBITDA is just one benchmark that investors consider. As you can see in the chart above, as a percentage of revenue, the transactions recorded above range from 4.75% to 42.75%. That’s a pretty hefty swing, when the EBITDA multiple is ranging from .44 to 7.12. That “hefty swing” is why investors consider two multiples: The industry multiple and your own multiple. They want to see industry multiples as a whole, to ensure that your sector is a good one. But they also want to see how you’re performing when stacked up against the competition.
Why Is Seller’s Discretionary Earning Important?
The seller’s discretionary earnings include pretax and pre-interest profits before non-cash expenses; one owner’s benefits; one-time investments; and any non-related income or expenses, as noted by Mark Daoust on his QuietLight Brokerage website.
To clarify, it’s all about the amount of income being paid to the owner. This gives an investor an idea of the realistic earnings that can be expected with a business.
There are a variety of other types of expenses that can be factored into the SDE, such as large one-time expenses; multiple owners’ compensation; and adjusted expenses. This is where the accounting and finance teams step in. Regardless of the details, you can see why this metric is important, as well. SDE ranges from $59,000 to $840,776 in the report. Because this number can include a whole host of factors, it will be scrutinized by the investor.
Investors Consider Other Intangibles
This type of report is the perfect place to start as you begin to assess your own operation and consider selling your company. Now you need to put yourself in an investor’s shoes, and consider that they’ll be looking at a number of things beyond EBITDA.
Is your company growing? They’ll want to know what your Compounded Annual Growth Rate is, and whether you’re gaining new accounts. They’ll also want to know if you’re diversified in your clients, and they’ll especially want to ensure that all of your revenue isn’t coming from 1-2 clients.
What is the industry doing? Investors will look to see what the overall EBITDA rate is, but they’ll also look at the overall trends. Is there growth? Consolidation? Capacity to expand? Remember, an investor is all about the long-term, not what you’ve done in the past.
Is your company innovative and well-managed? I can’t tell you how undervalued talent is in this day and age. We focus so heavily on the types of reports I’ve included in this column that we forget it’s all about the people behind the scenes. If you have a talent-laden team and a culture that encourages innovation and thinking big, you can expect to drive your price tag higher.
How solid is your cash flow? Cash flow is the lifeblood of all businesses, and any investor wants to see that you have great cash flow as part of the equation. You can see how the investor moves from the big picture to a more granular view of your business. These performance indicators are often the backbone of the negotiations, and give both parties a place to start discussions.
It’s why we always encourage a valuation before you put your business on the marketplace. Consider the story of Brad Van Leeuwen of Trade Print Finishing.
Family Business That Values An Outsider Perspective
One of the main difficulties investors have when assessing the value of a family business is establishing comparables. Because a family business is not obligated to disclose financials like a publicly-traded company, it can be difficult to compare apples to apples.
Bankers rely on organizations like RMA Data to provide anonymous, pooled results (much like the PeerComps report we presented earlier).
But what does an owner do when they want to put their business on the market? Too often an owner struggles with their own business value because they don’t know what investors are truly looking for. That’s why we encourage a business valuation, a recommendation heeded by Brad Van Leeuwen of Trade Print Finishing.
Setting The Wheels In Motion
Brad was a third generation family business owner, having taken ownership of the company originally started by his grandfather. Originally, the company specialized in engraving social announcements and stationery, which eventually evolved into wide format printing finishing processes like foil stamping, diecutting and UV coating.
Early retirement had always been one of his goals, but Brad could never seem to get the wheels in motion for selling his business. He talked about selling to his operations manager, but the plan never seemed to gain any traction.
Finally, Brad decided he could wait no longer. But he didn’t know how he stacked up against the competition or how to set his price.
He decided to get a business valuation. Brad had been tracking his equipment value for years, and he’d assumed that would dictate the true value of the company. The valuation, however, revealed otherwise.
Profitability, Not Assets, Drives The Price
“I had always watched the equipment to see what I could sell it for if I had to liquidate,” he said. “But the valuation indicated that profitability was the true driver of value.”
It’s not just profitability today, either. It’s the long-term outlook –will you be profitable 3-10 years down the line? It’s why the numbers like EBITDA factor into a company’s valuation, but there are so many factors that establish your own multiple.
That’s the ultimate takeaway. It’s not just industry multiples on which you need to focus. It’s your own personal multiple. These benchmarks are a good starting point, but once you see what the landscape is like, then it’s really time to get to work.
Remember, it’s not the industry multiples I tell you that ultimately matter in the end. It’s what the valuation indicates to an investor that dictates how much your business is truly worth.
Rock LaManna, President and CEO of LaManna Alliance, helps printing owners and CEOs use their company financials to prioritize and choose the proper strategic path. He can be reached by email at Rock@RockLaManna.com