Chris Lynn11.17.14
As the last Labelexpo exhibition clearly showed, digital printing and converting is becoming mainstream in the label industry. Different technologies and configurations are on offer which can be broadly classified as electrophotographic (toner-based) printing, or UV-curable or water-based inkjet printing. The products range from $20,000 desktop-type printers to $2 million integrated systems with laser diecutting, and “hybrid” machines that mix digital and analog print technologies.
This much will be familiar to regular readers of L&NW, which has been reporting on digital print adoption for many years. Yet the market penetration of digital printers – about 1,700 units, mainly HP Indigos – is still limited. And the production of digitally printed PS labels remains small – about 2.4% by printed area, according to I.T. Strategies. So most small- to mid-sized label converters have not yet made the leap into the new technology.
Why is this? For many, the reasons are the usual concerns about new technology: is it reliable? Can I get support? Will it be superseded by newer technology before I get a return on investment? And so on. For some, concerns about print quality – mostly misplaced – predominate. But for the majority of printers who are not early adopters, the hesitation is based on economics. They ask themselves:
Should I be making a major investment of any kind, given the economy, my target market’s dynamics and my strategy?
Should my investment be in new digital printing technology or something else entirely – other equipment, upgrades to current capabilities, different initiatives?
If I invest in digital printing equipment:
a. What’s my break-even run-length, compared to flexo?
b. What does my new ability to address short run or variable data or fast turnaround jobs mean for my current and potential new customers?
c. What premium can I get, if any, for these new offerings?
d. How do I need to organize my business to handle a higher volume of smaller orders?
e. What does this do to my competitiveness?
In my experience, owners and managers who are considering investments in digital technology and have got past the first two questions spend far too much time analyzing and agonizing over question 3a, and not nearly enough time on b, c, d and e. This is certainly understandable – a break-even calculation is based on readily-quantifiable costs: plates, labor, setup time, waste, ink, etc; whereas potential new markets, customers or other revenue sources are much harder to estimate, and may be dismissed by the hard-nosed accountant as pie-in-the-sky, especially when (s)he realizes that the average order value may actually go down as the runs get shorter.
This is where software simulation can help. For many of us, a “simulator” is one of those machines at theme parks where an immersive and stomach-churning experience is created with widescreen video and hydraulic rams moving under computer control. Or perhaps we think of the venerable Microsoft Flight Simulator, now one of the oldest PC video games still in use. Manufacturing process simulation or “discrete event” simulation is perhaps less exciting than either of these, but it may actually reduce the stomach-churning induced by contemplating a big investment. How? By allowing a user to model the effect of the investment on a PC before actually making it. A good model might allow you to envision the effect on productivity, profitability or delivery time of an investment in capital equipment, people or other resources. It lets you play with variables like the number of operators on a shift, the rate at which new orders arrive and their size, and the time taken for each step in a process. It will show you bottlenecks and let you see the effect of different assumptions on throughput. Simulation is a great tool for companies pursuing Lean Manufacturing, as proposed by many articles in this periodical over the years.
A Simulation Example
What follows is taken from a simulation I created for my client Prototype & Production Systems, Inc., makers of the DICEweb inkjet add-on for a flexo press. To avoid giving the impression that this is a sales pitch, let me mention that other “hybrid” print solutions, mixing inkjet and flexo production in a single production line with converting, include the new Mark Andy Digital Series, the Fujifilm/FFEI Graphium, and the Colordyne Flexo-bility. With the appropriate assumptions for cost and profitability, the simulation could apply to any of these.
The simulation sets up three parallel workflows, with print jobs entering all three simultaneously:
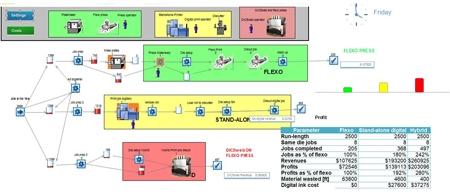
Fig. 1 – The simulation screen
A conventional flexo workflow: after job preparation, the work packet either goes to plate making or bypasses this if the plates already exist. The user decides what proportion of jobs need new plates. The work then moves on-press with plate and die setup and makeready, printing, diecutting and clean-up. Diecutting is inline so it takes no additional time, but the press is blocked from accepting another job until clean-up is completed for the previous one.
A standalone digital system workflow: after a brief setup, the digital printer runs a batch of jobs that use the same die; the roll is moved to a separate diecutter (which requires some set-up time, but which can run in parallel with the printer’s next job), and the finished roll is removed.
A hybrid workflow: after a brief setup for the print job and the inline die station, the digital printer prints and the job is diecut “on-the-fly” with no roll change.
Figure 1 shows the simulation screen: jobs enter on the left side at a user-selectable average daily rate and are processed through each of the workflows. The flexo process steps are in green, the standalone digital in yellow, and the hybrid in pink. At the top of the screen are the resources available: the capital equipment and the operators. There are also two buttons that bring up tables into which the process assumptions can be entered: the time taken to make plates and to set up equipment, the run speeds, hourly costs, etc. At the bottom right is a table summarizing the results for the simulation run, and a bar chart showing the relative profitability of the three workflows for each run.
The small rectangles, some of which are partially filled in red, are queues; the red indicates how many jobs are waiting because of a bottleneck further downstream. The processes light up in orange when they are active.
In the run shown, the assumptions included an average run-length of 2,500 feet with five 4-color jobs at a time being ganged on the same die. With the assumptions used, the standalone system completed 82% more jobs than the flexo press, and the hybrid 148% more, in both cases with significant savings in materials, and greater profitability.
This model is grossly simplified, compared to a real plant – there is only one of each piece of equipment and one operator for each; the simulation is run for four weeks, with one eight hour shift, five days a week. Of course, more complex configurations shift patterns can also be modeled.
The system is capable of generating other useful reports, such as the utilization rate of the assets. The simulation allows users to play with different “what if” scenarios. For example:
What if the run speed of the digital printer were only 50% of the flexo press and offline diecutter?
What if the hourly costs of the different printing systems were different?
What if the cost of digital ink (or a click charge) changed?
How does the volume of completed jobs change if every job needs new plates and dies?
What is the effect of doubling (or halving) the number of jobs my sales force brings in per day?
How does average run-length affect productivity and profitability? (In other words, the answer to the hesitant buyer’s question on break-even mentioned above…)
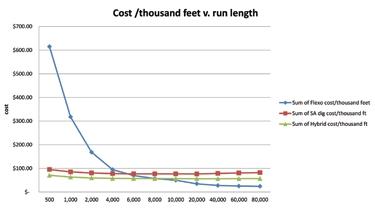
Fig. 2 – Relative costs for 3 printing methods
Because the simulator can run through a month’s production in seconds, and it can apply a random element to many of the variables it uses, it is possible to run dozens of experiments with different assumptions, and to export the results to create graphs that provide insights into the behavior of the different workflows under different conditions. For example, Figure 2 shows the total cost per thousand feet for each of the three workflows for different run-length jobs:
These costs include the operating costs of the respective machines, plus consumables. As you can see, using the assumptions that were entered into the simulation model, the break-even on cost between flexo and digital occurs between 4,000-10,000 feet, depending on whether the digital technology is standalone or hybrid.
Figures 3 & 4 show some relative profitability comparisons in

Fig. 3 – Relative profitability at 5 new jobs/day
terms of gross profit (or, more accurately, contribution margin) over the 4-week simulation time. The difference between the two graphs is instructive – the first assumes five new jobs entered per day, and the second assumes ten new jobs per day.
Let’s examine what is happening here: for short-run jobs, fewer jobs mean less profit in all cases. For long-run jobs, production bottlenecks limit the possible profit; you can see that, for 80,000 ft. jobs, the maximum profit for each workflow is the same whether five or ten new jobs are coming in per day. It is in the middle ground that stark differences in profitability emerge when ten or more new jobs/day come in. Both standalone and hybrid digital systems do better than flexo for the shortest runs, but the stand-alone system drops off more quickly than the hybrid. This is mainly because the simulation is set up with assumed speeds of 200 fpm for flexo, 160 fpm for hybrid, and only 120 fpm for the standalone digital system. But the fact that the standalone system requires the printed roll to be removed to a separate diecutting machine also hurts productivity.
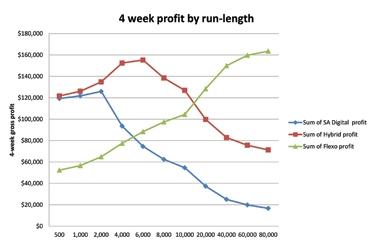
Fig. 4 - Relative profitability at 10 new jobs/day
So, in this model, the break-even point for standalone is at about 5,000 feet for both five and ten jobs/day joining the input queue; whereas, given plenty of new jobs, the hybrid system remains the most profitable option until run-lengths reach about 15,000 feet. As the runs get longer, of course, the greater speed of the flexo press, and the greater cost of digital ink (or click charges) negatively affect both digital systems.
Conclusions
The statistician George Box wrote that “All models are wrong, but some are useful.” Plant simulation models are no exception – they contain plenty of over-simplifications and the assumptions used in them can always be questioned. But I would argue that, for any manufacturer of products, they can provide actionable insights when used with care.
In the case of the simple label manufacturing example I have discussed here, one lesson is that, to get a good return on a digital system, you must “feed the beast.” If you have made an investment in an asset that excels at doing short-run work as opposed to other work, you’d better have plenty of short-run work coming in – and you’d better avoid bottlenecks upstream in pre-flighting or other operations that might limit throughput to the digital system. Another lesson is that, in most circumstances, ganging jobs on the same die and diecutting inline with printing (provided it does not slow the entire process) is more efficient than running printing and diecutting separately. You might say that these conclusions are pretty obvious, but simulation allows you to quantify the effects of different variables – run speed, labor rates, cost of digital ink, etc – and make judgments on what factors are most important to your business.
I hope I have shown that plant simulation software can be a useful tool in analyzing new investments in production technology. A final suggestion: enterprise value can be grown by saving manufacturing costs, but this leads to an analysis of potential digital investments that is too narrow. Value and competitive advantage are mainly created by growing revenues with new products and services, entering new markets and building brands. Digital printing technologies can help to do all these things, and scenario modeling can help to evaluate the digital options. But in the end, the boldness and good judgment of the entrepreneur will determine who wins.
Chris Lynn is a principal of Hillam Technology Partners LLC, an Atlanta-based consultancy providing marketing and business development services to graphics technology businesses. He can be reached at chris@hillamtech.com.
This much will be familiar to regular readers of L&NW, which has been reporting on digital print adoption for many years. Yet the market penetration of digital printers – about 1,700 units, mainly HP Indigos – is still limited. And the production of digitally printed PS labels remains small – about 2.4% by printed area, according to I.T. Strategies. So most small- to mid-sized label converters have not yet made the leap into the new technology.
Why is this? For many, the reasons are the usual concerns about new technology: is it reliable? Can I get support? Will it be superseded by newer technology before I get a return on investment? And so on. For some, concerns about print quality – mostly misplaced – predominate. But for the majority of printers who are not early adopters, the hesitation is based on economics. They ask themselves:
Should I be making a major investment of any kind, given the economy, my target market’s dynamics and my strategy?
Should my investment be in new digital printing technology or something else entirely – other equipment, upgrades to current capabilities, different initiatives?
If I invest in digital printing equipment:
a. What’s my break-even run-length, compared to flexo?
b. What does my new ability to address short run or variable data or fast turnaround jobs mean for my current and potential new customers?
c. What premium can I get, if any, for these new offerings?
d. How do I need to organize my business to handle a higher volume of smaller orders?
e. What does this do to my competitiveness?
In my experience, owners and managers who are considering investments in digital technology and have got past the first two questions spend far too much time analyzing and agonizing over question 3a, and not nearly enough time on b, c, d and e. This is certainly understandable – a break-even calculation is based on readily-quantifiable costs: plates, labor, setup time, waste, ink, etc; whereas potential new markets, customers or other revenue sources are much harder to estimate, and may be dismissed by the hard-nosed accountant as pie-in-the-sky, especially when (s)he realizes that the average order value may actually go down as the runs get shorter.
This is where software simulation can help. For many of us, a “simulator” is one of those machines at theme parks where an immersive and stomach-churning experience is created with widescreen video and hydraulic rams moving under computer control. Or perhaps we think of the venerable Microsoft Flight Simulator, now one of the oldest PC video games still in use. Manufacturing process simulation or “discrete event” simulation is perhaps less exciting than either of these, but it may actually reduce the stomach-churning induced by contemplating a big investment. How? By allowing a user to model the effect of the investment on a PC before actually making it. A good model might allow you to envision the effect on productivity, profitability or delivery time of an investment in capital equipment, people or other resources. It lets you play with variables like the number of operators on a shift, the rate at which new orders arrive and their size, and the time taken for each step in a process. It will show you bottlenecks and let you see the effect of different assumptions on throughput. Simulation is a great tool for companies pursuing Lean Manufacturing, as proposed by many articles in this periodical over the years.
A Simulation Example
What follows is taken from a simulation I created for my client Prototype & Production Systems, Inc., makers of the DICEweb inkjet add-on for a flexo press. To avoid giving the impression that this is a sales pitch, let me mention that other “hybrid” print solutions, mixing inkjet and flexo production in a single production line with converting, include the new Mark Andy Digital Series, the Fujifilm/FFEI Graphium, and the Colordyne Flexo-bility. With the appropriate assumptions for cost and profitability, the simulation could apply to any of these.
The simulation sets up three parallel workflows, with print jobs entering all three simultaneously:
Fig. 1 – The simulation screen
A standalone digital system workflow: after a brief setup, the digital printer runs a batch of jobs that use the same die; the roll is moved to a separate diecutter (which requires some set-up time, but which can run in parallel with the printer’s next job), and the finished roll is removed.
A hybrid workflow: after a brief setup for the print job and the inline die station, the digital printer prints and the job is diecut “on-the-fly” with no roll change.
Figure 1 shows the simulation screen: jobs enter on the left side at a user-selectable average daily rate and are processed through each of the workflows. The flexo process steps are in green, the standalone digital in yellow, and the hybrid in pink. At the top of the screen are the resources available: the capital equipment and the operators. There are also two buttons that bring up tables into which the process assumptions can be entered: the time taken to make plates and to set up equipment, the run speeds, hourly costs, etc. At the bottom right is a table summarizing the results for the simulation run, and a bar chart showing the relative profitability of the three workflows for each run.
The small rectangles, some of which are partially filled in red, are queues; the red indicates how many jobs are waiting because of a bottleneck further downstream. The processes light up in orange when they are active.
In the run shown, the assumptions included an average run-length of 2,500 feet with five 4-color jobs at a time being ganged on the same die. With the assumptions used, the standalone system completed 82% more jobs than the flexo press, and the hybrid 148% more, in both cases with significant savings in materials, and greater profitability.
This model is grossly simplified, compared to a real plant – there is only one of each piece of equipment and one operator for each; the simulation is run for four weeks, with one eight hour shift, five days a week. Of course, more complex configurations shift patterns can also be modeled.
The system is capable of generating other useful reports, such as the utilization rate of the assets. The simulation allows users to play with different “what if” scenarios. For example:
What if the run speed of the digital printer were only 50% of the flexo press and offline diecutter?
What if the hourly costs of the different printing systems were different?
What if the cost of digital ink (or a click charge) changed?
How does the volume of completed jobs change if every job needs new plates and dies?
What is the effect of doubling (or halving) the number of jobs my sales force brings in per day?
How does average run-length affect productivity and profitability? (In other words, the answer to the hesitant buyer’s question on break-even mentioned above…)
Fig. 2 – Relative costs for 3 printing methods
These costs include the operating costs of the respective machines, plus consumables. As you can see, using the assumptions that were entered into the simulation model, the break-even on cost between flexo and digital occurs between 4,000-10,000 feet, depending on whether the digital technology is standalone or hybrid.
Figures 3 & 4 show some relative profitability comparisons in
Fig. 3 – Relative profitability at 5 new jobs/day
Let’s examine what is happening here: for short-run jobs, fewer jobs mean less profit in all cases. For long-run jobs, production bottlenecks limit the possible profit; you can see that, for 80,000 ft. jobs, the maximum profit for each workflow is the same whether five or ten new jobs are coming in per day. It is in the middle ground that stark differences in profitability emerge when ten or more new jobs/day come in. Both standalone and hybrid digital systems do better than flexo for the shortest runs, but the stand-alone system drops off more quickly than the hybrid. This is mainly because the simulation is set up with assumed speeds of 200 fpm for flexo, 160 fpm for hybrid, and only 120 fpm for the standalone digital system. But the fact that the standalone system requires the printed roll to be removed to a separate diecutting machine also hurts productivity.
Fig. 4 - Relative profitability at 10 new jobs/day
So, in this model, the break-even point for standalone is at about 5,000 feet for both five and ten jobs/day joining the input queue; whereas, given plenty of new jobs, the hybrid system remains the most profitable option until run-lengths reach about 15,000 feet. As the runs get longer, of course, the greater speed of the flexo press, and the greater cost of digital ink (or click charges) negatively affect both digital systems.
Conclusions
The statistician George Box wrote that “All models are wrong, but some are useful.” Plant simulation models are no exception – they contain plenty of over-simplifications and the assumptions used in them can always be questioned. But I would argue that, for any manufacturer of products, they can provide actionable insights when used with care.
In the case of the simple label manufacturing example I have discussed here, one lesson is that, to get a good return on a digital system, you must “feed the beast.” If you have made an investment in an asset that excels at doing short-run work as opposed to other work, you’d better have plenty of short-run work coming in – and you’d better avoid bottlenecks upstream in pre-flighting or other operations that might limit throughput to the digital system. Another lesson is that, in most circumstances, ganging jobs on the same die and diecutting inline with printing (provided it does not slow the entire process) is more efficient than running printing and diecutting separately. You might say that these conclusions are pretty obvious, but simulation allows you to quantify the effects of different variables – run speed, labor rates, cost of digital ink, etc – and make judgments on what factors are most important to your business.
I hope I have shown that plant simulation software can be a useful tool in analyzing new investments in production technology. A final suggestion: enterprise value can be grown by saving manufacturing costs, but this leads to an analysis of potential digital investments that is too narrow. Value and competitive advantage are mainly created by growing revenues with new products and services, entering new markets and building brands. Digital printing technologies can help to do all these things, and scenario modeling can help to evaluate the digital options. But in the end, the boldness and good judgment of the entrepreneur will determine who wins.
Chris Lynn is a principal of Hillam Technology Partners LLC, an Atlanta-based consultancy providing marketing and business development services to graphics technology businesses. He can be reached at chris@hillamtech.com.
