Jim Duvall & Joe Mausar01.11.07
Is it feasible to characterize several standard PSA properties such as peel adhesion, tack and plasticity by using a single test rather than three individual tests? The use of a new instrument may do just that and reduce the time required for research and development of new pressure sensitive adhesives, and quality assurance testing of existing adhesives.
Typically a series of standard tests would be used to characterize adhesive properties, including: Peel Adhesion tested according to ASTM D 3330, Loop Tack tested according to ASTM D 6195, and Plasticity measured according to ASTM D 926-98. The adhesive properties determined using these traditional test methods may be comparable with data from a Probe Material Analyzer1 test. Prior work reported by Chuang et al2 suggests that relationships exist between traditional PSA test method results and information obtained from a probe analyzer curve. To determine if the Probe Material Analyzer (PMA) can distinguish between multiple properties in a single repeatable test, a series of adhesives with the same chemical structure but varying degrees of standard adhesive properties were chosen for a comparative evaluation.
The first part of a PMA test entails inserting a probe into the adhesive (see Figure 1 for a graphic depiction of the test). Typically a stainless steel probe with radius of 0.562" is mounted to a load cell transducer, which measures the forces that are acting on the probe. The probe is oriented perpendicular to the sample surface. The load on the probe and the displacement are recorded throughout the test. Data collection is initiated when the transducer senses a predetermined load such as a starting force of 5 grams, at a defined insertion speed. The probe travels through the adhesive until the predetermined force is reached. The second part of the test occurs when the probe is allowed to retract from the adhesive until no contact exists between the two surfaces. The force required to separate the probe from the adhesive is recorded throughout the retraction phase. The test is concluded when the adhesive is no longer attached to the probe and the force reaches zero. The retraction curve may consist of one or more peaks.
The retraction curve consists of an initial elastic region where adhesive deformation is roughly linear. This peak or yield point indicates where the adhesive typically begins to debond from the probe surface. Softer or more pliable adhesives are believed to form filaments as the adhesive in the areas of remaining contact begin to orient and tensilize. As the filaments in softer adhesives reach their tensile strength, a second peak may be observed before the material finally debonds from the probe surface. Contrarily, high modulus or elastic adhesive may not exhibit a second peak as the energy cannot be absorbed in the adhesive mass and is therefore transferred to the adhesive/probe interface causing complete debonding at the initial peak.
The relationships previously established between traditional test method results and information from the retraction curve include:
- Peel adhesion: related to the positive work or energy absorbed during the retraction phase of the probe analyzer test defined as the total area under the retraction curve. The energy absorbed during the retraction process is related to the adhesive bond to the probe surface and the extent of deformation of the adhesive mass before debonding.
- Tack: related to the positive work under the first curve that indicates the extent of resistance to debonding and adhesive deformation as the probe is retracted and is also related to the total positive work under the curve that includes any secondary peaks.
- Plasticity: related to probe displacement at complete debonding. Shear properties may be related to displacement, however plasticity results prove to be more consistent for this purpose.
See Table 1, below, for data obtained through traditional test methods and PMA testing. PMA response curves for each of the adhesive types are shown in Figures 2 through 5.
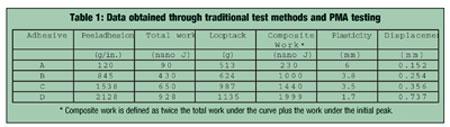
The PMA curve for adhesive "A" (Figure 2) indicates a degree of cross linking and therefore the elasticity for this adhesive is very high; this is evident from Table 1, which shows a low tack value and a high plasticity number. The high degree of elasticity is also seen in the PMA curve in the form of one major peak, the lack of significant secondary peaks (little deformation and absorbed energy), and short displacement at debonding (0.005").
The curve for adhesive "B" (Figure 3) shows that as the plasticity drops from approximately 6 to 3.8, a secondary peak is developed. This secondary peak is related to the deformation of the adhesive and development of filaments during debonding as described above. The peel adhesion and tack level of adhesive "B" have also increased from that of adhesive "A" that correlates to increased energy absorption in the adhesive upon deformation. This also coincides with a longer displacement at adhesive debonding (0.011").
The curve for adhesive "C" (Figure 4) also shows a secondary peak similar to adhesive "B". However, the secondary peak is more pronounced and the displacement has also increased further. This coincides with an increase in peel and tack. The shape of the curve is similar which is consistent with only a slight decrease in plasticity number.
A more significant decrease in plasticity number and therefore an increase in softness is seen when adhesive "D" is evaluated (Figure 5). The plasticity number decreased to 1.7 from 3.5 as seen in adhesive "C" previously. As the softness of the adhesive material increases further, a third peak or shoulder is developed as seen in Figure 5. The flexibility of the adhesive allows the filaments to form again (second peak). It is believed that the lower crosslink density allows the polymer chains to elongate or slide even further resulting in secondary filamentation and selective separation from the probe cause the decline in force to zero. This extended deformation also results in an increase in displacement (up to 0.030").
Additional parameters also consider relevant information obtained from a typical PMA retraction curve including: total area under the retraction curve (positive work), area under the first peak (positive work), and displacement at total adhesive debonding.
The first significant relationship between standard adhesive testing and probe analysis previously discussed is the correlation between peel adhesion and total work. A comparison was made between peel adhesion results and total work defined as the positive area under the curve in the retraction phase of the test (Figures 6 & 7).
A clear relationship can be seen between total work under the PMA curve and the peel adhesion measured for each adhesive. The relationship for the adhesive type tested is linear and somewhat predictable. Both of these properties are a measure of the total energy required to separate the adhesive from a surface resulting in good correlation of the data. Loop tack can be derived from the probe tack analyzer method by taking the sum of twice the total positive work and the addition of the positive work under the first peak, which is defined as composite work in this paper. The total work is an indication of how much energy is absorbed in the adhesive throughout the testing process. The area under the first peak is an indication of the initial debonding strength. A weighted composite of these two parameters is related to tack because it accounts for the resistance to initial debonding from the probe surface (first peak) and the total energy required to completely separate the adhesive from the probe (total area under the curve) (Figure 8).
The displacement of the probe at the point where the adhesive completely separates is an indication of the adhesive elastic properties. Adhesives that exhibit high flow or deformation properties show higher displacement values than adhesives that are harder or more resistant to flow. This displacement is therefore related to the degree of plasticity of the adhesive. Since low plasticity numbers indicate high flow adhesives, the displacement is inversely proportional to the plasticity number of the adhesive. This shows a good correlation between probe displacement at debonding and the inverse of plasticity number.
It is apparent that good correlations can be established between traditional PSA test methods and the PMA test method. Proportional and fairly predictable relationships were established between peel adhesion, tack and plasticity results and certain aspects of the PMA retraction curve. This allows the consolidation of several tests in to one comprehensive test, significantly reducing cycle time.
Jim Duvall is vice president of operations for Chemsultants' laboratory and process development operations. His background includes the development and testing of pressure sensitive, electrically conductive, heat sealable, and UV curable adhesives, as well as process design and optimization of adhesive coatings. Prior to joining Chemsultants in 1998 he served in several technical capacities with Furon Corporation (St. Gobain). Jim has both a B.S. and an M.S. in polymer science and engineering from Case Western Reserve University in Cleveland, OH, USA.
Typically a series of standard tests would be used to characterize adhesive properties, including: Peel Adhesion tested according to ASTM D 3330, Loop Tack tested according to ASTM D 6195, and Plasticity measured according to ASTM D 926-98. The adhesive properties determined using these traditional test methods may be comparable with data from a Probe Material Analyzer1 test. Prior work reported by Chuang et al2 suggests that relationships exist between traditional PSA test method results and information obtained from a probe analyzer curve. To determine if the Probe Material Analyzer (PMA) can distinguish between multiple properties in a single repeatable test, a series of adhesives with the same chemical structure but varying degrees of standard adhesive properties were chosen for a comparative evaluation.
The first part of a PMA test entails inserting a probe into the adhesive (see Figure 1 for a graphic depiction of the test). Typically a stainless steel probe with radius of 0.562" is mounted to a load cell transducer, which measures the forces that are acting on the probe. The probe is oriented perpendicular to the sample surface. The load on the probe and the displacement are recorded throughout the test. Data collection is initiated when the transducer senses a predetermined load such as a starting force of 5 grams, at a defined insertion speed. The probe travels through the adhesive until the predetermined force is reached. The second part of the test occurs when the probe is allowed to retract from the adhesive until no contact exists between the two surfaces. The force required to separate the probe from the adhesive is recorded throughout the retraction phase. The test is concluded when the adhesive is no longer attached to the probe and the force reaches zero. The retraction curve may consist of one or more peaks.
|
|
The retraction curve consists of an initial elastic region where adhesive deformation is roughly linear. This peak or yield point indicates where the adhesive typically begins to debond from the probe surface. Softer or more pliable adhesives are believed to form filaments as the adhesive in the areas of remaining contact begin to orient and tensilize. As the filaments in softer adhesives reach their tensile strength, a second peak may be observed before the material finally debonds from the probe surface. Contrarily, high modulus or elastic adhesive may not exhibit a second peak as the energy cannot be absorbed in the adhesive mass and is therefore transferred to the adhesive/probe interface causing complete debonding at the initial peak.
The relationships previously established between traditional test method results and information from the retraction curve include:
- Peel adhesion: related to the positive work or energy absorbed during the retraction phase of the probe analyzer test defined as the total area under the retraction curve. The energy absorbed during the retraction process is related to the adhesive bond to the probe surface and the extent of deformation of the adhesive mass before debonding.
- Tack: related to the positive work under the first curve that indicates the extent of resistance to debonding and adhesive deformation as the probe is retracted and is also related to the total positive work under the curve that includes any secondary peaks.
- Plasticity: related to probe displacement at complete debonding. Shear properties may be related to displacement, however plasticity results prove to be more consistent for this purpose.
See Table 1, below, for data obtained through traditional test methods and PMA testing. PMA response curves for each of the adhesive types are shown in Figures 2 through 5.
The PMA curve for adhesive "A" (Figure 2) indicates a degree of cross linking and therefore the elasticity for this adhesive is very high; this is evident from Table 1, which shows a low tack value and a high plasticity number. The high degree of elasticity is also seen in the PMA curve in the form of one major peak, the lack of significant secondary peaks (little deformation and absorbed energy), and short displacement at debonding (0.005").
|
Figure 2 |
The curve for adhesive "B" (Figure 3) shows that as the plasticity drops from approximately 6 to 3.8, a secondary peak is developed. This secondary peak is related to the deformation of the adhesive and development of filaments during debonding as described above. The peel adhesion and tack level of adhesive "B" have also increased from that of adhesive "A" that correlates to increased energy absorption in the adhesive upon deformation. This also coincides with a longer displacement at adhesive debonding (0.011").
|
Figure 3 |
The curve for adhesive "C" (Figure 4) also shows a secondary peak similar to adhesive "B". However, the secondary peak is more pronounced and the displacement has also increased further. This coincides with an increase in peel and tack. The shape of the curve is similar which is consistent with only a slight decrease in plasticity number.
|
Figure 4 |
A more significant decrease in plasticity number and therefore an increase in softness is seen when adhesive "D" is evaluated (Figure 5). The plasticity number decreased to 1.7 from 3.5 as seen in adhesive "C" previously. As the softness of the adhesive material increases further, a third peak or shoulder is developed as seen in Figure 5. The flexibility of the adhesive allows the filaments to form again (second peak). It is believed that the lower crosslink density allows the polymer chains to elongate or slide even further resulting in secondary filamentation and selective separation from the probe cause the decline in force to zero. This extended deformation also results in an increase in displacement (up to 0.030").
|
Figure 5 |
Additional parameters also consider relevant information obtained from a typical PMA retraction curve including: total area under the retraction curve (positive work), area under the first peak (positive work), and displacement at total adhesive debonding.
The first significant relationship between standard adhesive testing and probe analysis previously discussed is the correlation between peel adhesion and total work. A comparison was made between peel adhesion results and total work defined as the positive area under the curve in the retraction phase of the test (Figures 6 & 7).
|
Figure 6 |
|
|
|
Figure 8 |
The displacement of the probe at the point where the adhesive completely separates is an indication of the adhesive elastic properties. Adhesives that exhibit high flow or deformation properties show higher displacement values than adhesives that are harder or more resistant to flow. This displacement is therefore related to the degree of plasticity of the adhesive. Since low plasticity numbers indicate high flow adhesives, the displacement is inversely proportional to the plasticity number of the adhesive. This shows a good correlation between probe displacement at debonding and the inverse of plasticity number.
Conclusion
It is apparent that good correlations can be established between traditional PSA test methods and the PMA test method. Proportional and fairly predictable relationships were established between peel adhesion, tack and plasticity results and certain aspects of the PMA retraction curve. This allows the consolidation of several tests in to one comprehensive test, significantly reducing cycle time.
|
1) A PMA-1000 Probe Material Analyzer supplied by ChemInstruments Inc. of Fairfield, OH, USA was used for this comparative analysis. 2) Grunlan, Holguin, Chuang, Perez, Chavira, Quilatan, Akhave and Mehrabi, Combinatorial Development of Pressure-Sensitive Adhesives, Avery Research Center and Avery Dennison Performance Polymers, Pasadena, CA, USA, 2004. |
